Derivatives, Funding, Open Interest and Liquidations
Section 1 of 4
Derivative types, prices and basis
Your learning goal
Distinguish derivative measurements and explain why they do not establish a certain direction.
Derivative data can add context, but it is easy to misread. Funding is not a guaranteed income stream, open interest is not buy volume, and a liquidation heatmap is often an estimate. This lesson explains the contracts and measurements before Level 8 examines margin and leverage losses.
Key idea
Read units, reference prices and coverage before interpreting a derivatives dashboard.
Education only. Crypto assets can lose substantial value or become worthless. No lesson requires buying an asset, depositing money or sharing real passwords, private keys or recovery words.
Dated futures, perpetuals and options
A dated future has contract specifications and a maturity or settlement process. A perpetual generally has no scheduled expiry and uses mechanisms such as funding to influence its relationship with the reference market. An option gives its buyer a specified right under terms such as strike, expiry and exercise style. The seller has the corresponding obligation. Premium, settlement and margin rules matter.
These are contracts, not interchangeable forms of spot ownership. A call commonly relates to buying at a specified strike, while a put relates to selling, but some products are cash-settled or reference futures. An option can expire without value, and selling options can create substantial obligations. This course teaches recognition and risk awareness, not an options strategy. Always identify contract size, quote, settlement asset and eligibility before interpreting its price.
Think of a bet between two neighbours in Melbourne about the price of petrol. Neither buys any petrol. They only agree that whoever guesses wrong pays the other the difference. A derivative works in a similar way: it is a contract whose value comes from the price of something else.
Last, index, mark and futures basis
Last price is the latest trade in the particular instrument. An index aggregates reference prices according to a methodology. Mark price is a calculated valuation used for functions such as unrealised PnL and margin assessment under venue rules. It can differ from both the last trade and an executable price. Do not assume every venue uses the same formula.
Basis is a defined difference between a derivative price and its reference, sometimes expressed as an amount or percentage. State the convention. A price discrepancy can reflect carrying conditions, funding expectations, liquidity or contract terms rather than a free guaranteed opportunity. Margin and stop triggers may use different references. A chart based on last trades can therefore cross a line at a different time from a mark-price liquidation assessment.
In Tokyo, a train ticket booked months ahead can cost more or less than one bought on the day. The gap between the two prices tells you something about what people expect and how much they value waiting. In futures markets, that gap is called the basis.
CME Group defines the basis as the difference between the spot price of an asset and its futures price. In this lesson we write it as futures minus spot, so a positive number means futures cost more. Some sources use the opposite sign, so always check.
Basis = futures price − spot price and Basis % = basis ÷ spot price × 100When futures cost more than spot, the market is in contango; when they cost less, it is in backwardation. A CME article from September 2021 describes contango as the usual state in crypto, and recalls that in March 2020, when crypto prices fell by about half, the market moved into extreme backwardation. For perps, the gap between the perp and the index plays a similar role and feeds directly into funding.
A wide basis can reflect strong demand for leveraged exposure; a negative one can reflect fear. Both describe the moment. Neither tells you the next move. One more popular number claims to show how the crowd is leaning.
Section 2 of 4
Funding direction, payments and intervals
Why does a perpetual need a funding rate
Imagine a ferry ticket in Istanbul that can be resold forever but never used. If enough people want the ticket, its resale price could drift far above the real fare, because nothing pulls it back. A perp faces the same problem: with no expiry, nothing forces its price to meet the spot price.
Exchanges solve this with funding: small, regular payments between the traders holding long positions (who gain if the price rises) and those holding short positions (who gain if it falls). Binance Academy explains that funding is not a fee the exchange collects. It is a transfer from one group of traders to the other.
Exchanges track two prices to work this out. The index price is an average of the asset's spot price across several exchanges. The mark price is the exchange's fair estimate of the perp's value, used to value positions. When the perp trades above the index, the market is paying a premium to be long; when it trades below, longs are cheaper than spot.
The payment encourages traders to take the side that pulls the price back: if longs must pay, holding a short earns a little, so some traders switch. So when the rate is positive, who actually pays?
Work out who pays whom
On Binance's description, the rule is short. When the funding rate is positive, longs pay shorts. When it is negative, shorts pay longs. Kraken's learning centre describes the same direction: if contracts trade above spot, longs pay; if below, shorts pay.
| Perp price compared with spot | Funding rate | Who pays | Who receives | What the payment encourages |
|---|---|---|---|---|
| Above spot (premium) | Positive | Long positions | Short positions | More shorts, fewer longs |
| Below spot (discount) | Negative | Short positions | Long positions | More longs, fewer shorts |
| Close to spot | Near zero or a small default | Very little either way | — | Little change |
A positive rate tells you that, at that moment, demand to be long pushed the perp above spot, so longs paid to keep their positions. That describes crowd positioning. It is not a forecast: crowded longs can stay crowded for weeks, or unwind in minutes.
Knowing the direction is half the picture. The other half is how much money actually changes hands.
Calculate a funding payment
Funding is charged on the full size of your position, called its notional value, not on the deposit you put down. That one detail surprises many beginners.
Funding payment ≈ position notional × funding rateSome sites "annualise" funding to make it comparable: 0.01% × 3 intervals × 365 days ≈ 10.95% a year. Treat that as a translation, not a prediction, because funding is reset every interval and can swing sharply in volatile markets.
The examples assumed three payments a day. That is common, but not universal, which is worth checking before any number makes sense.
Check how often funding is paid
A bus pass in Toronto might be charged weekly or monthly; the price per day depends on which. Funding works the same way. On Binance Futures, funding has typically settled every eight hours, three times a day, and Binance Academy notes that since 2025 some contracts can switch to four-hour intervals. Kraken's learning centre says its funding interval is every eight hours for US clients and every hour for clients in the European Economic Area and other regions.
So a rate of 0.01% means different things on different venues: three payments a day, six, or twenty-four. Formulas differ too; Binance's includes a "clamp" that dampens swings, and other exchanges use their own rules.
Before comparing funding across exchanges, check each contract's information page for the interval, the formula and any cap. Data sites that line up funding "across exchanges" may be comparing different intervals. Next, a number that tells you how big the whole perp market is.
Funding commonly involves payments between positions under a perpetual's rules, with direction, timing and calculation specified by the venue. A negative rate reverses direction under that convention. Rates can vary, intervals differ, and the notional or rate may be sampled under specific rules. Funding is therefore one cash flow in a position, not a standalone guaranteed return. Read the instrument's current specifications and do not annualise a brief high rate as though it stays fixed.
Section 3 of 4
Open interest, ratios and liquidation cascades
Open interest, volume and long-short ratios
Count open interest not only volume
Picture a book club in Buenos Aires. Volume is how many times books were swapped this week. Open interest is how many books are currently out on loan. Lots of swapping can leave the number on loan unchanged.
CME Group's futures course puts it this way: volume counts every contract traded, while open interest counts only the contracts that remain active. Open interest rises when new positions are opened on both sides, stays the same when one trader hands a position to another, and falls when both sides close.
| Step | What happens | Volume this step | Open interest after |
|---|---|---|---|
| 1 | Ana opens 2 long contracts; Ben opens 2 short contracts | 2 | 2 |
| 2 | Ana closes 1 long by selling to Caro, who opens 1 new long | 1 | 2 (unchanged) |
| 3 | Caro closes her long by selling to Ben, who closes 1 of his shorts | 1 | 1 |
Analysts watch open interest alongside price. Rising OI with a rising price means new money is entering positions; falling OI means positions are closing. But OI does not tell you who is right, and in crypto it is often quoted in US dollars, so it rises when the price rises even if no new contracts are opened.
Open interest tells you the size of the bet. The next number tells you how expensive the futures are compared with the coin itself.
Treat the long short ratio with care
Every futures contract has a buyer and a seller. That means the total long contracts and total short contracts on an exchange are always equal. So what does a "long/short ratio" measure?
Binance explains that its ratio compares accounts, not contracts. It divides the number of accounts with net long positions by the number with net short positions. For example, if 60% of accounts are net long and 40% net short, the ratio is 60 ÷ 40 = 1.5. Binance gave a real example: on 21 March 2023, its BTCUSDT ratio was 0.77, with about 56% of accounts holding a position net short.
The ratio is also exchange-specific, so a reading from one venue may not represent the whole market. Some sites show "top trader" versions with their own definitions. Use the ratio as a rough crowd snapshot, labelled with its source and definition.
All these numbers matter most in one situation: when positions are closed by force.
Increasing open interest alone therefore does not prove net bullish intent. It may reflect hedging, arbitrage, speculation or combinations. Compare price, basis and context with explicit limitations rather than assigning one inevitable direction to the number.
Liquidations, cascades and estimated heatmaps
Reported liquidations describe events captured by a provider's feed. A heatmap may estimate possible levels from assumptions about entry, leverage and positions, rather than observe every account's actual liquidation price. Venue coverage, reporting delays, missing events and changing collateral can affect accuracy. A colourful chart is not a complete map of future forced orders.
State what is measured and what is inferred. A cluster of estimates can be a context observation, but it does not prove price must move there. Liquidation mechanics depend on mark prices, margins and contract rules, which the next level explores. For practice, use supplied figures and explain the measurement boundary rather than opening a leveraged position to validate a dashboard.
Understand liquidation without the maths
Think of a car loan in Germany. If you stop making payments, the lender can take the car and sell it, whether or not you agree, and often at a poor price. A liquidation is the derivatives version.
Kraken's learning centre describes it this way: when the market moves against a position and funds fall below the platform's maintenance margin requirement, the platform closes the position automatically. The trader usually loses most or all of the margin in that position, and fees can make it worse.
Exactly where liquidation happens depends on the leverage, the margin, fees and the exchange's rules. Level 8 works through a simplified liquidation-price calculation. For now, keep one idea: the higher the leverage, the smaller the price move needed to trigger liquidation.
One trader's liquidation is personal. When thousands happen at once, they can move the whole market, as the next section shows.
Follow a liquidation cascade
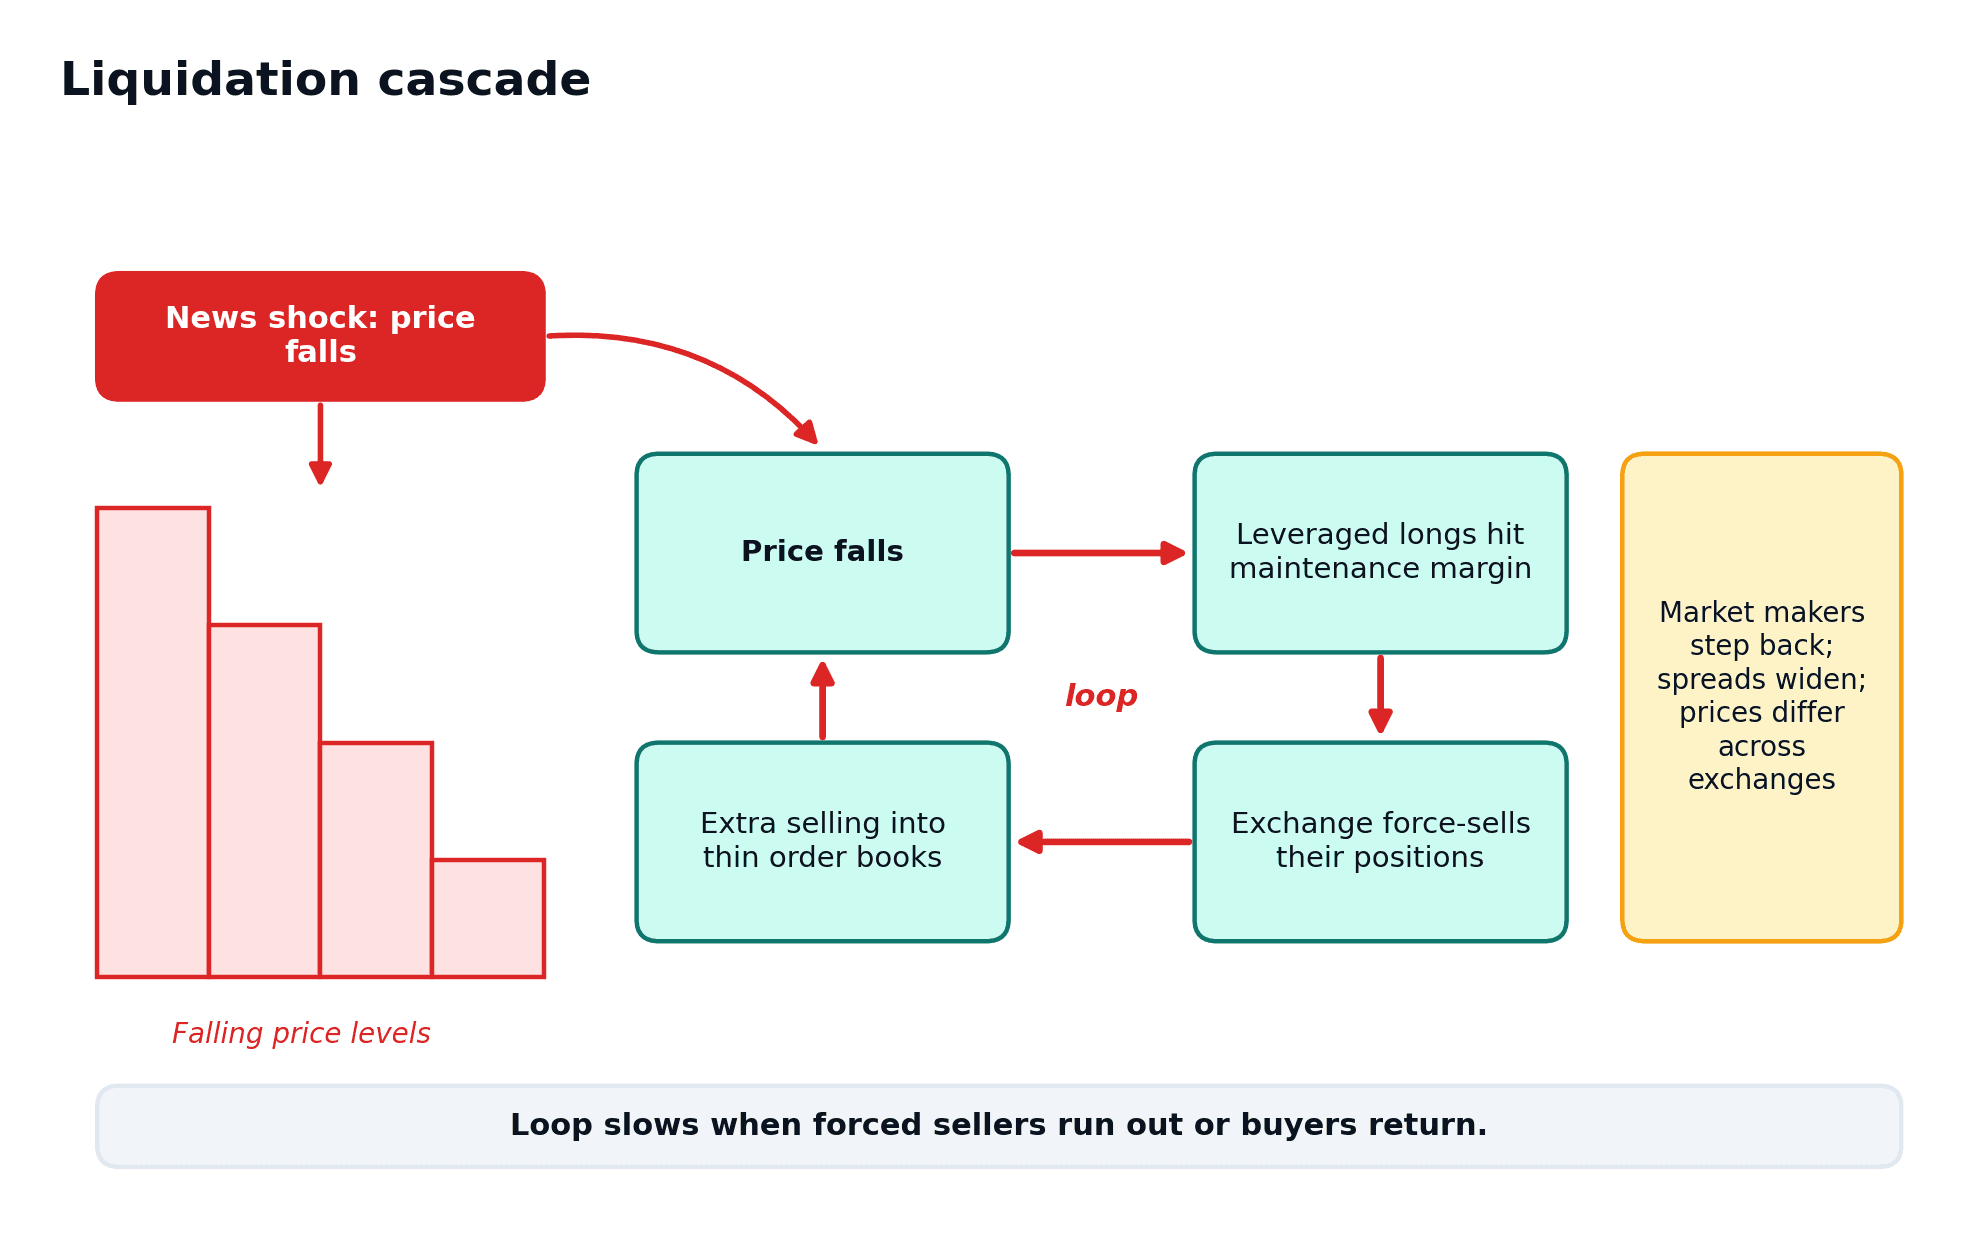
A liquidation cascade is a feedback process. An initial price move reduces leveraged equity. Positions hit their maintenance rules and are reduced or closed. That action can worsen prices in thin markets, pushing additional positions toward liquidation.
A reported liquidation total covers the venues and events captured by the source. A heatmap often estimates possible levels from assumptions. Keep observed events and inferred future levels separate. The feedback can also operate in the other direction when shorts are forced to close.
Read these numbers as information not signals
A weather forecaster in Johannesburg looks at pressure, wind and humidity together, and still says "60% chance of rain", not "it will rain". Derivatives data deserve even more humility.
Funding, open interest, basis, the long/short ratio and liquidation totals are all useful descriptions of how traders are positioned. But they are noisy. Each exchange calculates them differently, intervals differ, data sites combine venues in different ways, and some figures are estimates. Liquidation totals depend on what exchanges choose to report. In a crash, prices on different venues can split apart, as the USDe example showed.
They are also reflexive: when many people watch the same number, their reactions change it. "Funding is very high" can lead some traders to close longs, which lowers funding, before anything else happens.
So write these numbers down with their source, venue, time and definition, and use them to describe the market's mood. Do not treat them as instructions. Now practise reading them.
Read diagram as text
News shock lowers price → leveraged longs reach maintenance margin → the exchange force-sells positions → extra selling meets thin order books → price falls further.
Market makers may step back, spreads may widen and prices may differ across exchanges. The loop can slow when forced sellers run out or buyers return.
This is a fictional feedback mechanism. Reported liquidation events and estimated liquidation levels are different data.
Section 4 of 4
Everyday example, practice and review
Try the following questions aloud or on paper before opening the worked answers. Compare your reasoning as well as your final answer.
Try it yourself
Try each question on paper or explain your answer aloud before opening the worked answers. This practice is for learning; it is not scored.
1. Calculate funding at positive 0.03 percent on USD 5,000 under the supplied convention.
2. One existing long transfers its position to a new long while the short remains. Can volume rise without open interest rising?
3. Name two limitations of a liquidation heatmap.
Compare with the worked answers
Worked answers
1. USD 5,000 × 0.0003 = USD 1.50 paid by the long under the stated convention.
2. Yes. A trade occurs, but the outstanding contract remains rather than a new pair being created.
3. Coverage can be incomplete and levels can depend on estimated entry, leverage or collateral. Delays and feed definitions also matter.
Quick knowledge check
Try each question on paper or explain your answer aloud before opening the worked answers. This practice is for learning; it is not scored.
Does increasing open interest alone prove a bullish market?
Compare with the worked answers
Worked answers
No. Outstanding contracts have counterparties and can reflect many motives. Direction requires additional evidence and remains uncertain.
What to remember
✓ Contract terms determine the meaning of derivative prices.
✓ Funding is a variable cash flow within exposure.
✓ Open interest, volume and estimated liquidations have different scopes.
Lesson completion check
References and further reading
References
CME Group: Introduction to Options ↗
Kraken: Managing margin and liquidations in multi collateral trading ↗
Coinbase: What is the funding rate ↗