On-Chain Data, Explorers and Measurement Limits
Section 1 of 4
Addresses, people and exchange transfers
Your learning goal
Interpret a metric using its method, coverage and timestamp.
A public ledger contains rich information, but a dashboard often adds labels and estimates before showing a simple number. Addresses are not people, exchange flows are not automatically sales, and activity can include internal movement or bots. This lesson helps you read on-chain evidence without stretching the observation into a certainty it cannot support.
Key idea
Describe what the data measures before explaining what may have caused it.
Education only. Crypto assets can lose substantial value or become worthless. No lesson requires buying an asset, depositing money or sharing real passwords, private keys or recovery words.
Addresses, transactions and people
What is on chain data
Think of a land registry office in Toronto. Anyone can look up which parcel changed hands, when, and for how much. What the registry does not tell you is who really lives there, why they sold, or whether two parcels belong to the same family. It is a public record of transfers, not a diary of intentions.
A public blockchain is a little like that registry. As you learned in Level 1, every confirmed transaction is recorded in blocks that anyone can read. On-chain data is information taken directly from that public record: which addresses sent and received coins, how much, when, and how many coins sit at each address. You can read it yourself through a block explorer, a website that displays the blockchain in readable form, such as mempool.space for Bitcoin or Etherscan for Ethereum.
Analytics firms such as Glassnode and Coin Metrics process this raw record into charts and metrics. That processing is useful, because nobody can read millions of transactions by hand. It is also where judgement creeps in: firms have to guess which addresses belong together, which belong to exchanges, and which transfers matter.
The registry analogy stops working in one way. A land registry usually records the owner's name. A blockchain records only addresses, which are strings of characters with no name attached. That single difference shapes almost every limit in this lesson. Start with the most quoted number of all: how many addresses are active.
Count active addresses carefully
Picture a café in Rome counting how many cups it served today. That number tells you something about how busy it was. But one customer might order five cups, and one office might send a single person to collect fifty. Cups are not customers.
Coin Metrics describes active addresses as a popular way to estimate the number of users, while warning that the match is imperfect. Its documentation notes that on blockchains where creating addresses and sending transactions is cheap or free, active addresses "can still be trivially forged". It also counts addresses that send zero coins, send to themselves, or take part in failed transactions.
To get closer to people, Coin Metrics also publishes "wallet" metrics, which group addresses it estimates belong to the same owner, because, in its words, users often own more than one address. Those groupings are estimates too. So treat active addresses as a rough measure of activity, best compared with itself over time on the same chain. The next set of metrics tries to track one special kind of owner: exchanges.
See how holdings are spread out
A school in Seoul can report how pocket money is spread among pupils: how many have a little, how many have a lot. Crypto analysts do the same with addresses. Holder distribution groups addresses by balance, for example under 1 coin, 1–10, 10–100 and so on, and shows how much of the supply sits in each group.
You met holder concentration in Level 5, where a few wallets holding most of a token was a red flag. The same caution applies when reading distribution charts. The biggest addresses are often not individuals at all. They can be exchanges holding coins for millions of customers, smart contracts such as bridges or staking contracts, or project treasuries. A chart might show "whales" accumulating when an exchange has consolidated its own wallets.
Some data firms publish "entity-adjusted" versions that try to group addresses by owner before counting. These are more realistic, but they inherit every error in the grouping. Before reading a distribution chart, check whether it counts addresses or estimated entities, and whether known exchange and contract addresses are excluded.
Distribution shows where coins sit. The next metric tries to show how much is moving, and it is the one most easily misread.
A transaction is a network action, while a token transfer is an asset movement that may appear inside that action. The grouping may rely on heuristics rather than verified identity. Active addresses therefore do not directly count unique human users. A metric may count senders, receivers or both during a chosen interval. A dashboard's convenient label should not hide what the data actually measures.
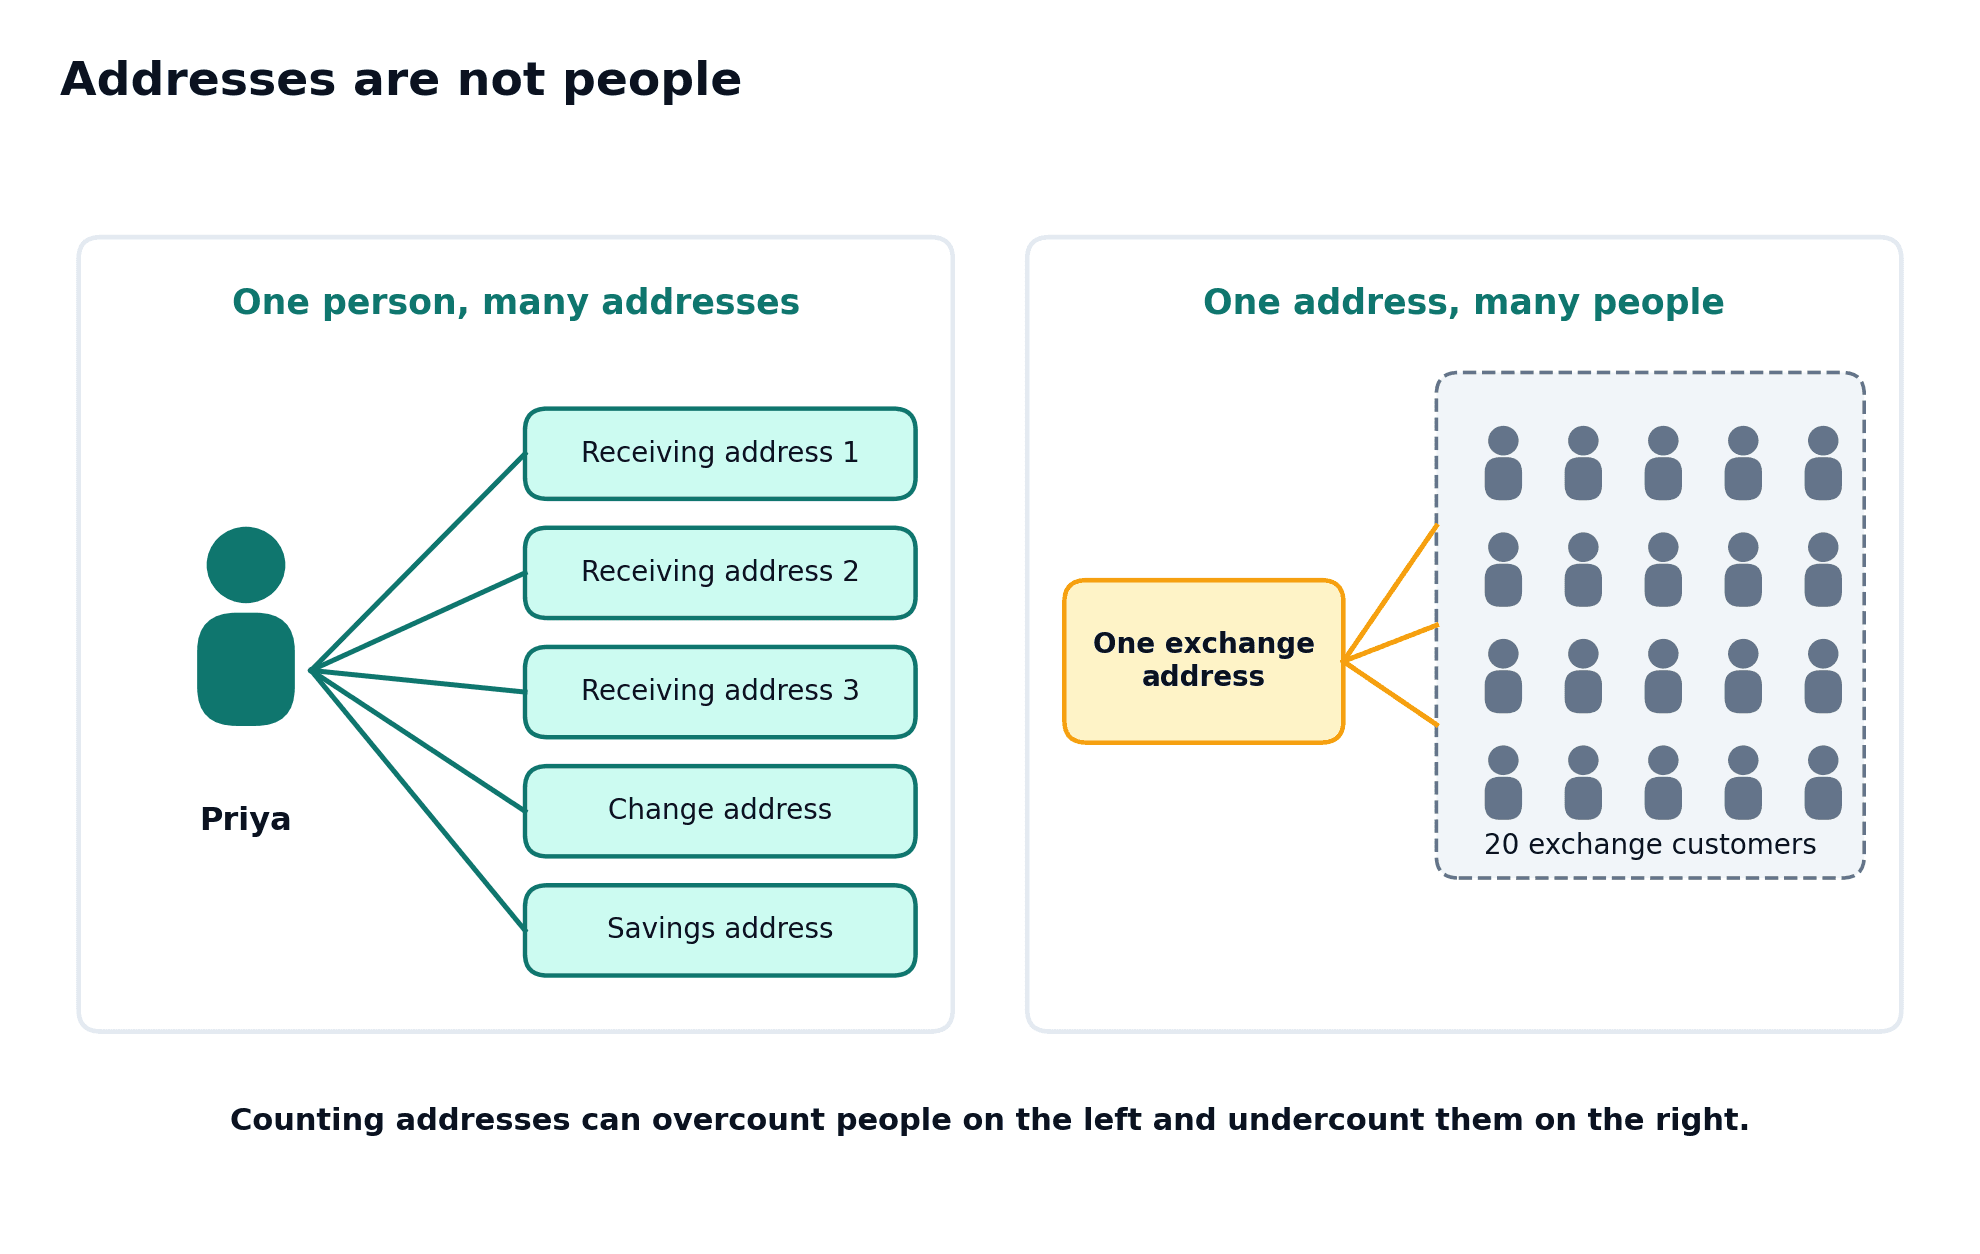
Read diagram as text
One person can use receiving addresses 1–3, a change address and a savings address.
One service address can represent many customers; the image draws twenty exchange customers.
Counting addresses can therefore overcount people in one setting and undercount them in another. It cannot directly count users.
Exchange inflows do not prove a sale
Think of a car park in Sydney. Cars driving in might be there to shop; cars driving out might be going home. Watching the gate tells you something about traffic, but not what each driver plans to do.
Exchange inflows are coins moving into addresses believed to belong to exchanges; exchange outflows are coins moving out. Analysts watch them because coins usually go to an exchange to be sold or used as margin, and leave an exchange to be held elsewhere. Glassnode tracks exchange balances, flows and counts of deposits and withdrawals.
The hard part is knowing which addresses belong to exchanges. Glassnode explains that it combines addresses confirmed by the exchanges, labels from outside sources, and clustering, which uses statistical rules to link addresses to a few known ones. Exchange wallets are constantly changing: Glassnode reports that one exchange it studied had nearly 25 million associated addresses.
So exchange flows are clues about intentions, filtered through guesses about ownership. Glassnode advises treating single large flows as preliminary until verified. From who is moving coins, the natural next question is who is holding them.
It does not prove that the deposited asset was sold. The service may move assets among its own wallets, and a provider may not recognise every exchange-controlled address. Net inflow is a calculation from captured flows under those definitions, not a complete view of exchange liabilities or customer intentions. Use a flow as a question to investigate rather than an instruction to trade.
Section 2 of 4
Transfer value, valuation and stablecoin supply
Transaction count, transfer value, fees and protocol usage measure different things. A large value transfer can occur in one transaction, and many tiny transfers can increase counts without comparable economic activity. Fees may indicate demand for a network resource, but unusual activity or congestion can change the relationship. A USD-valued series can rise because the asset price rises even when unit activity is unchanged.
Bots, wash activity and circular transfers can distort interpretations of growth. Applications may report gross flows that count repeated movements of the same value. A useful note identifies whether the metric counts distinct actions, units, users or value, and whether adjustments are applied. Compare more than one measure before describing adoption. A rising line is evidence of the defined series, not automatically of genuine independent demand.
| Metric | What is observed or estimated | What is not proven |
|---|---|---|
| Active addresses | Defined addresses active in an interval | Unique people |
| Entity count | Heuristic groups under methodology | Verified legal identities |
| Exchange inflow | Captured transfers to labelled addresses | Completed customer sales |
| Transfer value | Value under counting and price rules | Independent economic activity |
| Fees | Payments for network resources | Guaranteed token valuation |
| Revised history | Updated classifications | Information available at the old date |
Imagine Thandiwe in Durban pays for a R30 coffee with a R200 note and gets R170 back. Did R200 change hands, or R30? If you counted every note that moved, you would record R370 of "volume" for one coffee.
Read realised price and MVRV in plain words
Realised capitalisation commonly values coins at the market price associated with when they last moved, using a provider's defined methodology. Dividing that estimate by a matching supply basis gives realised price. Market value divided by realised value gives MVRV.
These are analytical estimates, not a census of what every owner paid. A transfer between one person's wallets, exchange custody movements or provider adjustments can break the simple last-moved-equals-last-bought interpretation. State the methodology and timestamp. A ratio does not establish an inevitable top, bottom or future return.
Watch the stablecoin supply
Think of a currency exchange counter at an airport in Jeddah. If the counter's drawer of US dollars grows, more people may be preparing to spend dollars somewhere. It does not tell you where or when.
Stablecoins, which you met in Level 3, are often the cash of crypto trading. The total stablecoin supply is how many stablecoin units exist. DeFiLlama, a data site, tracks the total stablecoin market cap and circulating supply over time, flows into and out of each stablecoin, how far each is from its peg, and which blockchains they sit on.
Some analysts read a growing stablecoin supply as more "dry powder" available to buy crypto. Be careful. Stablecoins are also used for payments, savings in countries with weak currencies, and settlement between firms. Supply can grow because an issuer minted coins for one large client, and coins can sit on a chain for months unused. A falling supply might mean redemptions to cash, or a move to a different stablecoin not in the chart.
So stablecoin supply describes how much crypto-dollar liquidity exists, not what it will be used for. On-chain data is only half of this lesson. The other half measures something softer: mood.
Section 3 of 4
Methodology, timestamps and bounded conclusions
Timestamps, revised history and methodology
Record provider methodology, timezone, interval, asset coverage and whether observations can be revised. Entity clustering can change when new information links addresses. A historical chart downloaded today may therefore differ from what was available at the time. This matters when testing whether an old signal would have been usable.
A retrospective test using newly classified historical data can accidentally give itself future information. Preserve snapshots or use point-in-time datasets where needed. Also check whether values are daily totals, end-of-day balances or moving averages. Mixing them can create false correlations. Measurement discipline is part of analysis, not a tedious appendix to it.
Every metric so far rests on one fragile step: turning addresses into owners. That step fails in both directions.
Exchange wallets are the biggest source of confusion. One exchange can control millions of addresses and move coins between them at any time. Until those addresses are labelled, internal moves look like real flows. Glassnode notes that exchange metrics "are subject to change" when new addresses are discovered, so past charts can be revised. A chart you screenshot today may look different next month.
Data can also be lagging. On-chain data shows a transfer once it is confirmed, but analytics firms need time to label and adjust it. By the time a clear pattern appears, the market may already have moved.
Technical limits are honest mistakes. The next limits are not always honest.
Write an appropriately limited conclusion
State the observation, definition, possible explanation, alternative and unresolved issue. For example: captured deposits to labelled exchange addresses rose over three days; this could indicate greater availability for sale, but internal movement and incomplete attribution remain possible. That sentence communicates more honestly than holders are definitely selling.
Use fictional or public protocol examples in class work without exposing your own financial addresses. Inspecting public data does not require connecting a wallet. The next lesson combines market, on-chain and sentiment evidence into a note that distinguishes calculations from forecasts. Good analysis makes the limits visible so a reviewer can see how much confidence the evidence warrants.
Section 4 of 4
Everyday example, practice and review
Try the following questions aloud or on paper before opening the worked answers. Compare your reasoning as well as your final answer.
Try it yourself
Try each question on paper or explain your answer aloud before opening the worked answers. This practice is for learning; it is not scored.
1. Why can USD transfer value rise with unchanged token-unit flow?
2. A large exchange-labelled transfer appears. Give two alternative explanations besides selling.
3. What should you preserve for a point-in-time research test?
Compare with the worked answers
Worked answers
1. The conversion price can rise while the quantity is unchanged.
2. An internal wallet reorganisation, custody migration or a deposit held without sale are possible explanations.
3. The dataset or snapshot available at the decision time, definitions, timestamps, coverage and revision information.
Quick knowledge check
Try each question on paper or explain your answer aloud before opening the worked answers. This practice is for learning; it is not scored.
Does an exchange inflow prove that the recipient sold the asset?
Compare with the worked answers
Worked answers
No. It records a captured transfer under attribution rules. Subsequent sale and motivation need separate evidence.
What to remember
✓ Addresses and entities are not automatically people.
✓ Flow attribution has coverage and classification limits.
✓ Revised historical data can affect a retrospective test.
Lesson completion check
References and further reading
References
Glassnode: Entities metric definitions ↗
Glassnode: Addresses metric definitions ↗
Glassnode: Exchange Data Transparency Notice ↗
Bitcoin community: Bitcoin Developer Guide Transactions ↗
Coin Metrics: Coin Metrics — Active Addresses (network data documentation) ↗
Coin Metrics: Coin Metrics — Active Wallets (network data documentation) ↗