Read Results Honestly and Build a Practice Routine
Section 1 of 3
Read the sample expectancy and full equity path
Your learning goal
Measure a sample using net outcomes and an appropriate benchmark.
A high win rate can coexist with a loss. A growing account can reflect new deposits rather than successful decisions. This lesson calculates a small paper sample, compares an appropriate benchmark and sets a review routine that distinguishes adherence from outcome. The numbers teach interpretation rather than statistical proof.
Key idea
Use the full net ledger and a fair comparison before judging a practice idea.
Education only. Crypto assets can lose substantial value or become worthless. No lesson requires buying an asset, depositing money or sharing real passwords, private keys or recovery words.
Win rate needs gain, loss and sample size
Win rate is the proportion of outcomes classified as wins under a stated convention. Average gain and average loss describe their magnitudes. Decide how to handle zero results and costs before calculating. Six gains and four losses in ten closed paper trades give a 60 percent win rate, but the percentage alone says little about profitability.
Suppose each gross gain is USD 20 and each gross loss USD 40. Six gains total USD 120 and four losses total USD 160. Gross result is negative USD 40. Adding a USD 1 cost per completed trade makes net result negative USD 50. The sample is small and supplied; it illustrates the relationship between frequency, magnitude and costs without estimating a reliable future win probability.
Calculate the net sample expectancy
Sample expectancy is average net outcome per trade. Here it is negative USD 50 divided by ten, or negative USD 5. Equivalently, a 60 percent share of USD 19 net gains combined with a 40 percent share of USD 41 net losses gives 0.6 × 19 minus 0.4 × 41, also negative USD 5.
The average describes this sample, not a promised future amount. One exceptional outcome can dominate a small sample, and trades may not be independent. Report the distribution and range, not only the mean. PipStart's Risk Reward Calculator can compare planned distances, but it does not calculate success probability or complete realised expectancy. Actual fills and fees belong in the result ledger.
Read drawdown from the complete equity path
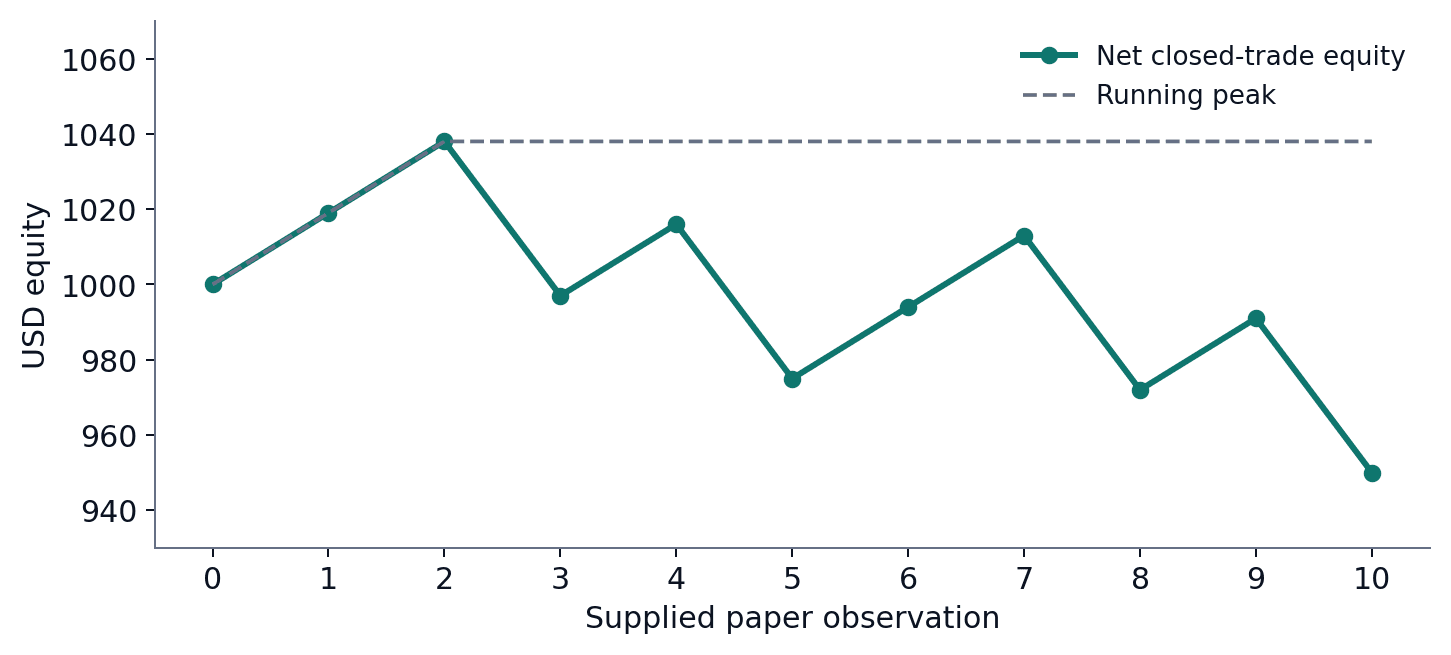
Start the supplied account at USD 1,000, use the stated sequence and subtract USD 1 per trade. The equity peaks at USD 1,038 after the second trade and ends at USD 950. Its largest subsequent fall in this sequence is USD 88, about 8.48 percent of that peak. Drawdown uses the peak as denominator rather than initial capital.
External deposits or withdrawals must be reconciled before describing performance. An intra-trade loss can also exceed a closed-trade series' observed drawdown, so report which observations are included. PipStart's Drawdown Calculator and Gain Recovery Calculator illustrate the arithmetic. They do not reveal unrecorded exposures or the probability of regaining a peak. A clean graph is useful only when the input series is complete for the stated question.
| Metric | Calculation | Result |
|---|---|---|
| Win rate | 6 divided by 10 | 60 percent |
| Gross gains | 6 × USD 20 | USD 120 |
| Gross losses | 4 × USD 40 | USD 160 |
| Gross total | 120 − 160 | Negative USD 40 |
| Costs | 10 × USD 1 | USD 10 |
| Net total | Negative 40 − 10 | Negative USD 50 |
| Net expectancy | Negative 50 divided by 10 | Negative USD 5 |
| Observed peak-to-final decline | 88 divided by 1,038 | About 8.48 percent |
Sequence and complete equity ledger appear in the graduation practice appendix. Sample metrics are not future probabilities.
Read diagram as text
The supplied sequence from observation 0 through 10 is USD 1,000; 1,019; 1,038; 997; 1,016; 975; 994; 1,013; 972; 991; 950.
The running peak reaches USD 1,038 at observation 2 and remains there. Peak-to-final drawdown is (1,038 − 950) ÷ 1,038, about 8.48%.
This is closed-trade net equity from the supplied paper sample, not a complete intratrade path or live performance claim.
Section 2 of 3
Benchmarks, review routine and reasons to pause
Use an appropriate benchmark
A benchmark must match the dates, available capital, currency and relevant costs. Depending on the question, it may be holding the researched asset, keeping hypothetical cash or following a recurring purchase schedule. Explain exposure differences: a fully invested hold and an intermittently exposed rule have different risk paths, even if they begin with the same capital.
For a separate supplied benchmark where a fully invested asset falls two percent and total costs are USD 2, USD 1,000 ends at USD 978. The paper rule's USD 950 is lower, while zero-interest fictional cash remains USD 1,000. These are capital-outcome comparisons under supplied assumptions, not proof that the benchmark is always preferable or that the risk is matched. State the question each comparison addresses.
Review process, schedule and reasons to pause
Set a review schedule
A car in Cape Town is serviced at set intervals, not only when it breaks down. So is a good plan.
| When | What to review |
|---|---|
| Weekly (10 minutes) | Journal complete? Any rule breaks? Security alerts? |
| Monthly | Crypto share against maximum allocation; fees paid; exchange exposure |
| Quarterly | Process review of every journal entry; rebalancing if due (Lesson C8.4) |
| Yearly | Purpose, horizon and limits; life changes; whether to continue at all |
| Trigger review | After any big loss, big gain, rule break, or change in income, health or family |
Put the dates in your calendar now; reviews that wait for a free afternoon never happen. A review is for looking back, not for placing trades.
What should a review look at? Not mainly whether you made money.
Review process separately from outcome
A goalkeeper in Madrid dives the right way and still concedes; another guesses wrong and the striker hits the post. Judging keepers only by the score teaches the wrong lessons.
The investor Michael Mauboussin, writing for CFA Institute, describes four boxes: a good process with a good outcome is "deserved success", a bad process with a good outcome is "dumb luck", and a bad process with a bad outcome is "poetic justice". The fourth box, a good process with a bad outcome, is an unlucky result. His point is that better decisions come from judging how a decision was made, not only how it turned out.
When you review, classify each entry's process first: followed, broken or unclear. Then look at the outcome. A rule-following loss is not personal failure. A rule-breaking gain is still a break, and the gain does not prove the rule was wrong.
Process-followed rate (%) = entries that followed the plan ÷ entries you can assess × 100Her one change for next quarter: write the time on every entry. Changing one habit at a time shows what helped.
Honest reviews sometimes point to a bigger conclusion: that it is time to stop.
Know when to pause or stop
A marathon runner in Seoul who feels chest pain stops. Stopping is part of good running, not a failure of it.
Write your stop conditions into the plan. Common ones include breaking the same rule three times in a review period, losing sleep, borrowing or wanting to, hiding activity from people close to you, needing to win back a loss, or a life change, such as a new baby or job loss, that makes the money matter more. Australia's Moneysmart describes an investor who kept adding money in the hope of recovering earlier crypto losses and ended up losing far more. Chasing losses is one of the clearest signs to stop.
Stepping back permanently is a valid result too. Deciding not to hold crypto, or to hold very little, is a successful use of what you learned.
Your plan, journal and review notes now form a set. In Level 10 they feed your graduation project, alongside your security checklist, wallet backup plan and research templates. First, practise using them.
Do not erase a losing sample from the research log. A sustainable routine includes scheduled data review, a small set of paper observations, a net-results reconciliation and a written decision to continue, revise or abandon the claim.
Read diagram as text
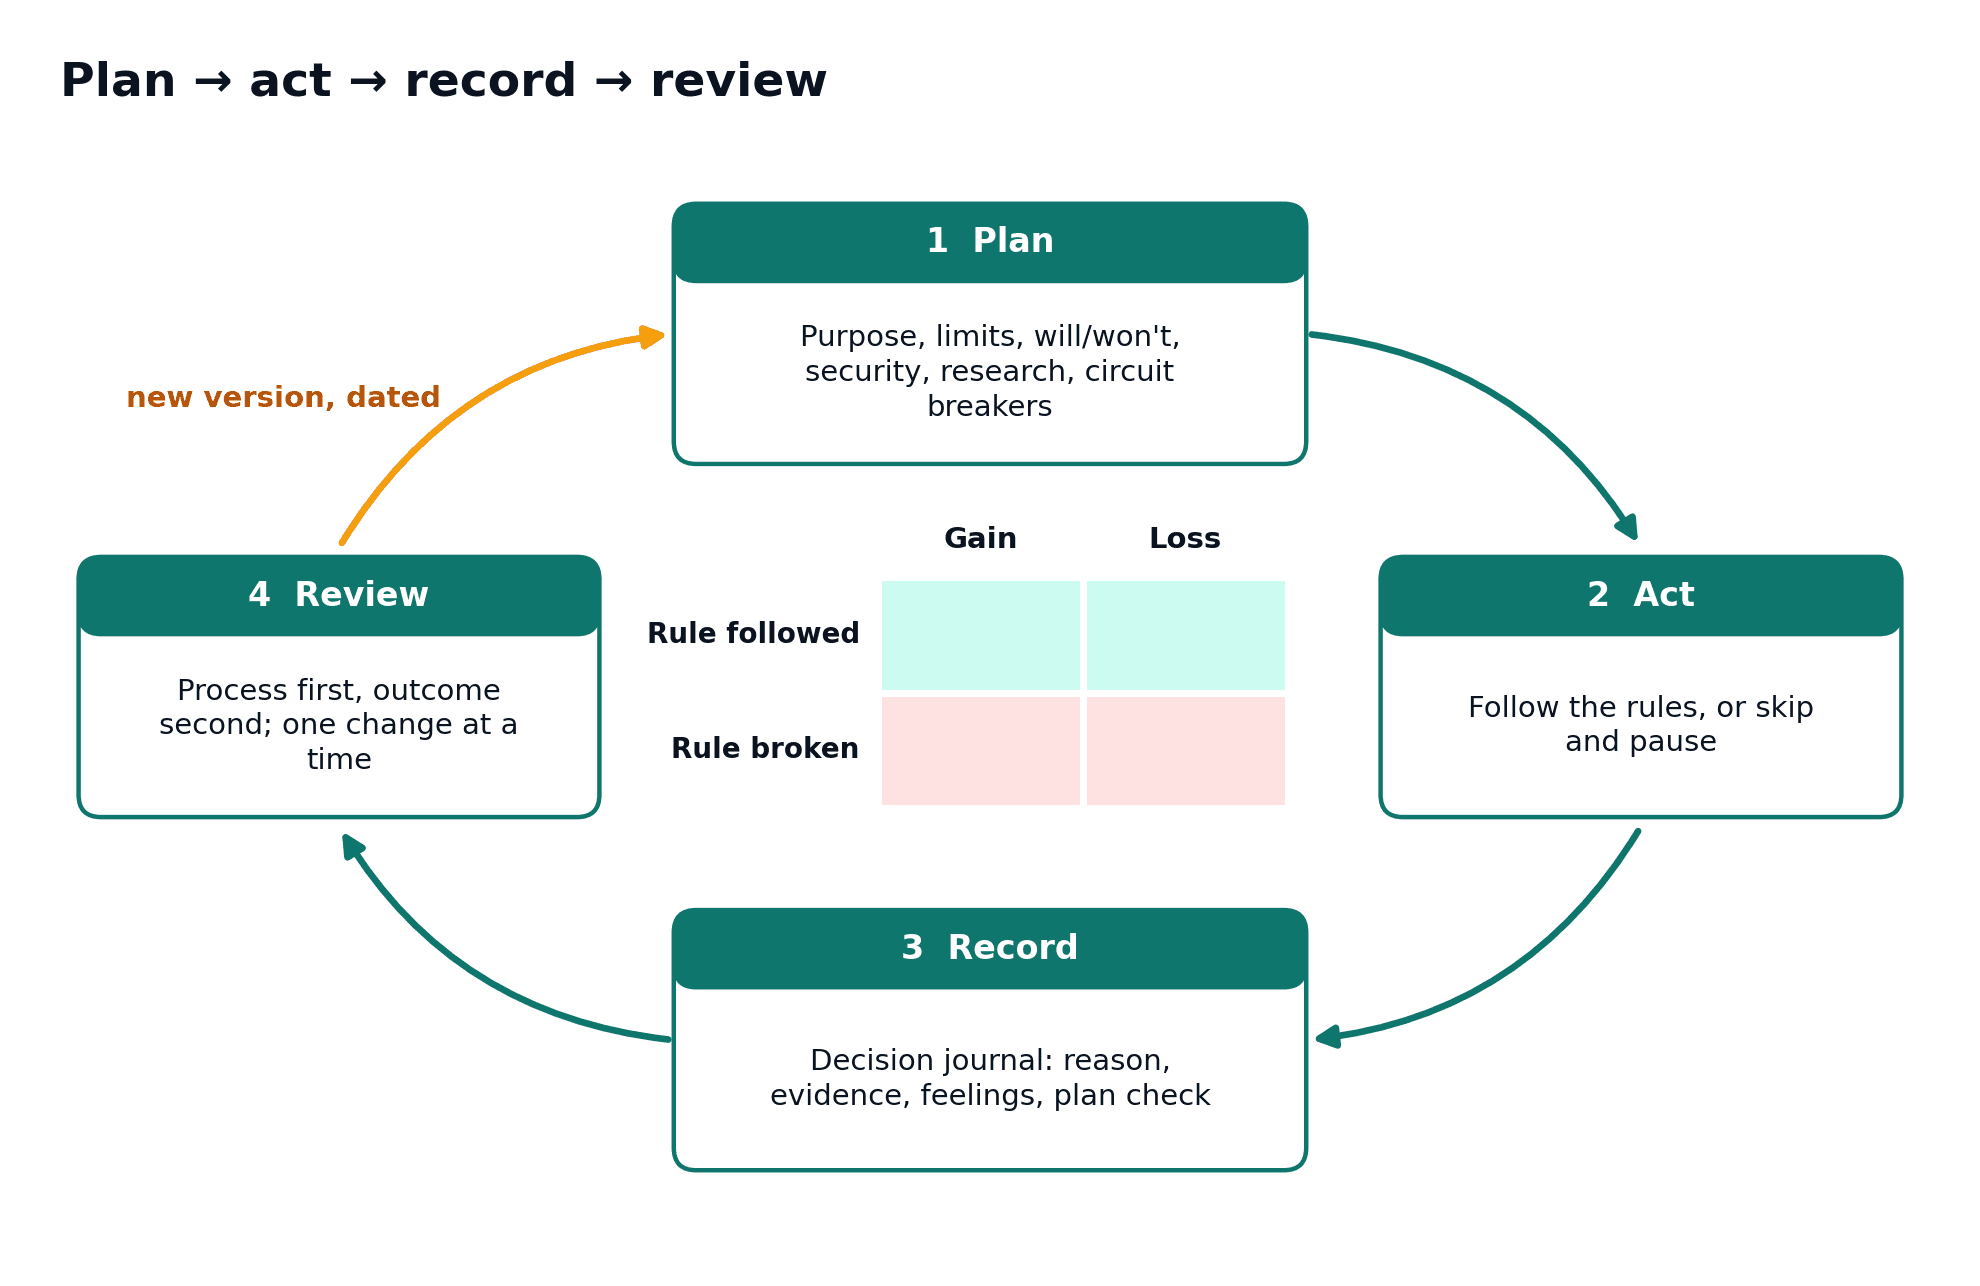
Plan: purpose, limits, permitted actions, security, research and circuit breakers. Act: follow the rules, or skip and pause.
Record: reasons, evidence, feelings and the plan check in a decision journal. Review: process first, outcome second; make one dated change at a time.
The centre grid separates rule followed or broken from gain or loss. A profitable rule break and a losing rule-following decision need different process judgments.
Section 3 of 3
Everyday example, practice and review
Try the following questions aloud or on paper before opening the worked answers. Compare your reasoning as well as your final answer.
Try it yourself
Try each question on paper or explain your answer aloud before opening the worked answers. This practice is for learning; it is not scored.
1. What net average gain and loss follow from the USD 1 per-trade cost?
2. Why does a 60 percent win rate not prevent the loss?
3. What should a reviewer say about a profitable action that ignored the rule?
Compare with the worked answers
Worked answers
1. Gains are USD 19 and losses USD 41 in magnitude.
2. Average losses are larger than gains, and costs reduce the combined result.
3. Its favourable outcome does not establish sound adherence. Review the deviation and avoid treating chance profit as evidence the rule is unnecessary.
Quick knowledge check
Try each question on paper or explain your answer aloud before opening the worked answers. This practice is for learning; it is not scored.
Is sample expectancy a guaranteed amount earned on the next trade?
Compare with the worked answers
Worked answers
No. It is an average over the stated observations, with uncertainty and possible dependence among outcomes.
What to remember
✓ Report magnitude and costs beside win rate.
✓ Drawdown needs a specified observation series and cash-flow treatment.
✓ Adherence and outcome are separate review dimensions.
Lesson completion check
References and further reading
References
MIT OpenCourseWare: Blockchain and Money ↗
MIT OpenCourseWare: Blockchain and the Design of Financial Systems lecture notes ↗
CFTC: Understand the Risks of Virtual Currency Trading ↗
Glassnode: Entities metric definitions ↗
Financial Conduct Authority: Financial Conduct Authority — Cryptoassets ↗
End of Level 9
You've finished the lessons in this level. Review what you learned before continuing.