Cycles, Dominance and Market Context
Section 1 of 3
Cycles, dominance and the denominator
Your learning goal
Use market-wide measures with explicit definitions rather than treating a narrative as a timetable.
Market stories often describe accumulation, expansion, euphoria and decline as a cycle. Such descriptions can help organise history, but the future does not have to follow the same timetable. This lesson examines market context, Bitcoin dominance and event calendars while keeping observations separate from predictions.
Key idea
Make a narrative measurable before treating it as evidence for a decision.
Education only. Crypto assets can lose substantial value or become worthless. No lesson requires buying an asset, depositing money or sharing real passwords, private keys or recovery words.
Cycles describe history
Farmers in Australia talk about good seasons and drought years. Seasons follow the calendar; droughts do not. Crypto markets have had long rising periods and long falling periods, called bull markets and bear markets. Like droughts, they are clear afterwards and hard to time in advance.
Drawdown = (peak − trough) ÷ peak × 100The clearest recent example is the 2022 bear market. Bitcoin fell roughly 75% from its November 2021 high to its November 2022 low. CNBC reported in November 2022, during the FTX collapse, that the two largest cryptocurrencies had lost about three-quarters of their value over twelve months, and that the total crypto market had shrunk from roughly US$3 trillion to around US$900 billion.
A fall that large is hard to climb back from. The gain needed to recover a loss is L ÷ (1 − L). For a 75% loss, that is 0.75 ÷ 0.25 = 3: a 300% gain only to return to the old high. Level 0 showed the same maths with a 50% fall.
Many people link Bitcoin's past cycles to its halvings, about every four years. Be careful with this story. Four halvings (2012, 2016, 2020 and 2024) are far too few to prove a pattern, and the market has changed a great deal since 2012. A halving changes how fast new bitcoin is created. It does not set a timetable for prices.
So far you have looked at one coin's chart. The next tool compares Bitcoin with the whole market.
Two analysts can apply different phase names to the same current market, and the boundaries are rarely objective without a stated method. Use cycle language as context rather than a calendar promise. A historical sequence is not enough to establish the probability, timing or size of a future move. The later testing lessons supply a more disciplined way to examine a repeated claim.
Calculate Bitcoin dominance
Think of a shopping centre in Riyadh. If the largest store's share of total sales falls, either the big store sold less, the smaller stores sold more, or new stores opened. The share alone does not say which.
Bitcoin dominance is that share for crypto. You learned market capitalisation in Level 5; dominance compares Bitcoin's market cap with the market cap of all crypto-assets together.
Bitcoin dominance = Bitcoin market cap ÷ total crypto market cap × 100CoinGecko's dominance chart shows stablecoins as their own slice. That matters: when people move money into stablecoins, Bitcoin's share can drop while the total holds up. Data sites may also count different token lists, so their dominance figures can differ.
Dominance compares crypto assets with each other. The next question is how crypto as a whole moves compared with everything else.
The calculation measures a share of indicated values within that universe, not the share of every person's holdings or the share of all actual cash invested. The ratio alone cannot identify which mechanism caused the movement.
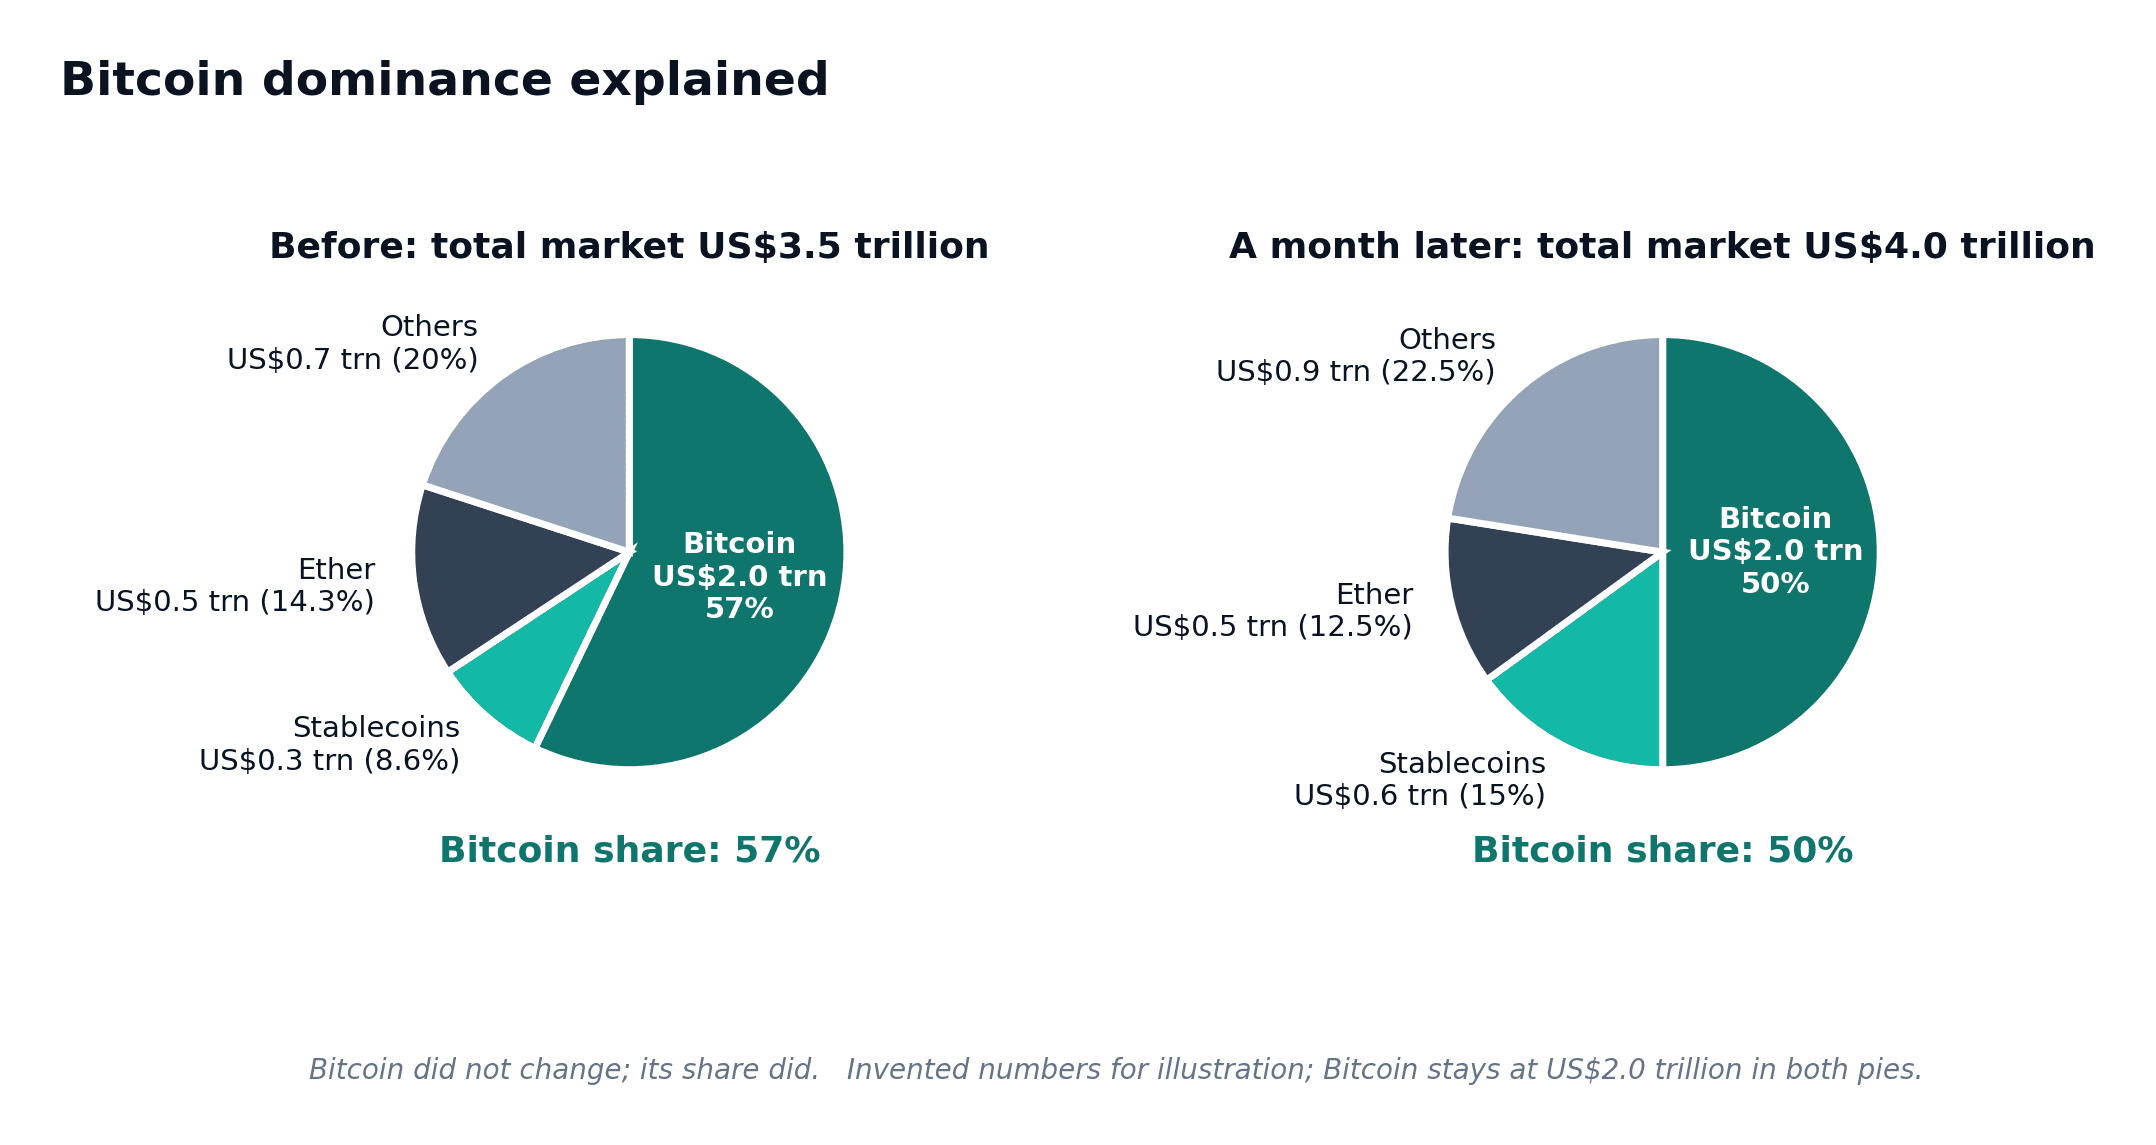
Read diagram as text
Before: Bitcoin 2.0, Ether 0.5, stablecoins 0.3 and others 0.7, all in USD trillions. Total 3.5; Bitcoin share about 57.1%.
Later: Bitcoin 2.0, Ether 0.5, stablecoins 0.6 and others 0.9. Total 4.0; Bitcoin share 50%.
The picture rounds the first Bitcoin share to 57%. The changing denominator reduces the share although the indicated Bitcoin value stays unchanged.
Check what the denominator includes
Including stablecoins adds assets whose purpose differs from volatile network tokens. Excluding certain assets or using different circulating definitions changes the total. Thinly traded tokens with large indicated values can distort comparisons. A data provider may also add or remove coverage, creating a discontinuity that resembles a market event.
For the fictional USD 1,000 billion total, excluding USD 100 billion of stablecoins leaves USD 900 billion. BTC dominance then becomes 66.67 percent rather than 60 percent, with BTC unchanged. Neither result is automatically wrong; they answer differently defined questions. A learner should name the universe and avoid comparing unlike series as though a change must represent buying or selling pressure.
| BTC indicated value | Selected market total | Dominance | Definition |
|---|---|---|---|
| USD 600 billion | USD 1,000 billion | 60.00 percent | Includes supplied stablecoin value |
| USD 600 billion | USD 900 billion | 66.67 percent | Excludes USD 100 billion stablecoins |
| USD 600 billion | USD 1,200 billion | 50.00 percent | Other indicated values increased |
Fictional inputs. Dominance is not cumulative cash flow or an inevitable rotation forecast.
Section 2 of 3
Macro conditions, flows and testable narratives
Macro conditions, exchange rates, flows and events
Interest-rate conditions, access to financing, exchange outages, legal developments and major network events can influence markets. Token unlocks, governance changes and product launches may also matter. Record the event date, announcement date and the source. Markets may anticipate a known event, so the price response need not begin when the event occurs.
Separate confirmed notices from rumours. A regulator's consultation is not the same as a final rule; a planned upgrade is not the same as a completed one. Context should identify plausible mechanisms and uncertainty rather than offer a single explanation for every price move. A broad market fall could reflect several forces together, and the data may not establish which was dominant.
Ask how closely crypto moves with other markets
Think of two friends walking in Seoul: sometimes side by side, sometimes apart. Correlation measures how closely two things move together, on a scale from −1 (always opposite) through 0 (little measured linear relationship) to +1 (always together).
Some people have described Bitcoin as moving independently of stock markets. The data tell a more complicated story. An International Monetary Fund (IMF) blog from January 2022 found that the correlation between Bitcoin's and the US S&P 500 index's daily returns was about 0.01 in 2017–19, close to little measured linear relationship, but rose to about 0.36 in 2020–21. The authors warned that this closer co-movement could spread shocks between crypto and wider markets.
Correlation describes the past over a chosen period, and it changes. You will use it again in Level 8, when you map how much of your money is exposed to the same risk. It tells you that two things moved together, not why. For that, analysts look at the bigger forces behind many markets at once.
Follow the macro drivers: rates, the dollar and liquidity
Think of a harbour in Istanbul. When the tide comes in, all the boats float higher; when it goes out, they all sink a little. Macro drivers are the tides of the whole economy: interest rates, the strength of major currencies and the amount of money available to invest, often called liquidity. Unlike a tide, they have no timetable.
When central banks raise interest rates, safe savings pay more, borrowing costs more and many investors take less risk. An IMF working paper from 2023, "The Crypto Cycle and US Monetary Policy", found that one common factor explained about 80% of the ups and downs in crypto prices, and that US Federal Reserve tightening reduced that factor through investors' appetite for risk. In plain words, crypto has tended to behave like a risky asset, not like a shelter.
The US dollar matters in a more direct way too. Most crypto prices are quoted in US dollars or dollar stablecoins. If you think in another currency, your price moves with both the coin and the exchange rate.
Macro links are tendencies, not laws. Analysts use them to explain the backdrop, not to call the next move. Since 2024, a newer channel has joined that backdrop: funds traded on ordinary stock exchanges.
Watch spot ETF flows as data not a promise
An exchange-traded fund (ETF) is a fund whose shares trade on a stock exchange. A "spot" bitcoin ETF holds bitcoin itself. The US SEC approved spot bitcoin ETPs in January 2024; in his statement of 10 January 2024, SEC Chair Gary Gensler stressed that approval was not an endorsement and called bitcoin "primarily a speculative, volatile asset". Spot ether ETFs began trading in the US in July 2024, on 23 July according to a law firm briefing dated the next day.
Flows are the money moving into or out of these funds each day. When buyers of fund shares outnumber sellers, the fund usually needs to hold more of the coin; when sellers dominate, it holds less. Analysts track flows as one sign of demand from people who use brokers rather than crypto exchanges. But flows describe yesterday. A week of inflows does not oblige next week to bring more, and outflows can follow quickly. ETFs also carry their own fees and risks, which Level 10 covers.
Flows, rates and dominance all change with news. Some news, though, is announced in advance, and that is where description and prediction are most often confused.
Read event calendars and keep analysis as description
In Mexico City, flower prices rise before Mother's Day, and sellers who stocked up early may already be selling on the day itself. Markets have a saying for this: "buy the rumour, sell the news". It describes prices moving before a known event, then sometimes reversing when it arrives.
Crypto has many scheduled events: token unlocks (Level 5), network upgrades, Bitcoin halvings and regulatory deadlines. Analysts keep calendars of them, because a large unlock adds supply and an upgrade changes how a network works. But the saying describes one behaviour that has been seen, not a rule. Sometimes prices rise before and after an event, sometimes they fall, and sometimes nothing visible happens. "Upgrade on the 15th" is context. "Price will rise before the 15th" is a prediction.
That difference runs through every tool in this lesson. Candles, scales, volume, dominance, correlation, macro data and ETF flows all describe the record. None of them sees the future. When several tools seem to agree, they may be repeating one piece of information, because many are built from the same prices.
A good habit is a three-column note: what the chart shows, what you think it might mean, and what would prove you wrong. Never leave the third column empty. Now practise that habit.
Make the narrative testable
Instead of saying falling dominance always causes an altcoin season, define the measure, threshold, asset universe, period and outcome to be examined. Include costs and a comparison with an appropriate benchmark if testing a trading idea. Specify what would count as a failure. A narrative without a measurable boundary can be adjusted endlessly after the fact.
Consider an alternative explanation. Dominance might fall because a few large non-BTC assets rise, without a broad increase across smaller tokens. A correlation in one period may disappear in another. The next lesson adds derivative measures, which also require careful definitions. No single ratio can replace asset rights, liquidity and a documented research method.
Section 3 of 3
Everyday example, practice and review
Try the following questions aloud or on paper before opening the worked answers. Compare your reasoning as well as your final answer.
Try it yourself
Try each question on paper or explain your answer aloud before opening the worked answers. This practice is for learning; it is not scored.
1. Calculate dominance for USD 450 billion BTC in a USD 900 billion universe.
2. Name two causes of a dominance change with BTC value unchanged.
3. Convert the claim the cycle repeats into one measurable research question.
Compare with the worked answers
Worked answers
1. 450 divided by 900 equals 50 percent.
2. Other assets' indicated values can change, or the provider can change coverage or supply methodology.
3. An acceptable question specifies a dated dominance series, a threshold, a defined set of assets and a fixed later return window, including contrary outcomes and costs if used for a trade test.
Quick knowledge check
Try each question on paper or explain your answer aloud before opening the worked answers. This practice is for learning; it is not scored.
Does falling BTC dominance prove every smaller token is rising?
Compare with the worked answers
Worked answers
No. The aggregate ratio can change because of a subset of assets, supply estimates or universe changes.
What to remember
✓ Cycle labels are easier to assign retrospectively.
✓ Ratios require defined numerators and denominators.
✓ Event context should distinguish notice, implementation and expectation.
Lesson completion check
References and further reading
References
MIT OpenCourseWare: Blockchain and Money ↗
CFTC: Understand the Risks of Virtual Currency Trading ↗
US SEC: US SEC — Statement on the Approval of Spot Bitcoin Exchange-Traded Products ↗