Supply, Market Capitalisation and Fully Diluted Value
Section 1 of 4
Read the supply numbers
Your learning goal
Calculate valuation labels and explain their limits.
A low price per token can be misleading when there are many tokens. Market capitalisation and fully diluted value combine price with a supply figure, but they also have limits. We will calculate both, state the supply definition and show why neither number is the amount of money invested in the project or the cash every holder could withdraw.
Key idea
Write the price, supply definition and timestamp beside each valuation.
Education only. Crypto assets can lose substantial value or become worthless. No lesson requires buying an asset, depositing money or sharing real passwords, private keys or recovery words.
Why does the number of tokens matter as much as the price
Imagine two pizza shops in Rome, each selling a pizza for €12 (an invented price). One cuts its pizza into 8 slices; the other cuts its pizza into 80. A slice costs €1.50 at the first shop and €0.15 at the second. The second slice is not "cheaper" in any useful sense; it is a smaller piece of the same pizza.
Token prices work the same way. An invented price of US$0.001 per token tells you nothing until you know how many tokens exist. To understand what a token's price really means, you need to read its supply, and then combine supply with price to get market capitalisation and fully diluted valuation.
The pizza analogy stops working in one way: a pizza has a fixed size, while many tokens keep changing in number as new ones are created, released or burned. So start with the three supply numbers every data page shows.
Read circulating total and maximum supply
Think of a company that has printed concert tickets. Some are on sale to the public now. Some are printed but held back for staff and sponsors. And the venue has a maximum number of seats that can never be exceeded. Token supply has the same three layers.
CoinGecko and CoinMarketCap both publish their methods. CoinGecko excludes tokens locked in smart contracts, vested allocations for teams, advisers and investors, escrowed funds, foundation and treasury holdings, and some core stakeholder holdings. CoinMarketCap calls circulating supply the crypto version of "public float", excluding private-sale allocations, team and foundation holdings, and locked or staked tokens.
Bitcoin is the best-known example of a capped asset: no more than 21 million BTC will ever exist by protocol rules, as you learned in Level 1. Ether, by contrast, has no fixed maximum. Knowing which kind of asset you are looking at leads straight to the next question: how supply changes over time.
Watch supply change emissions inflation and burns
Picture a central bank that prints new notes each year, and a shop that buys back its own gift vouchers and shreds them. One adds supply; the other removes it. Tokens can do both.
Emissions are new tokens entering the supply, for example as rewards to validators or miners, or as incentives for using an app. When emissions are ongoing, the token has inflation in the plain sense of more units over time. Burns permanently remove tokens, usually by sending them to an address nobody controls. Tokenomist, a data site formerly called Token Unlocks, describes a token's emission as the net of inflation and deflation, where deflation comes from burning.
You have already seen one burn. Since Ethereum's London upgrade in August 2021, the base fee of every transaction is burned. Binance Academy notes that during busy periods this burn can exceed new issuance, so ether's supply can shrink as well as grow.
| Design | How supply behaves | Example | Main thing to check |
|---|---|---|---|
| Capped | Grows towards a fixed maximum, then stops | Bitcoin (21 million) | How fast new units still arrive |
| Inflationary | Keeps growing with no fixed end | Tokens with permanent staking rewards | Annual issuance rate and who receives it |
| Burn-adjusted | Grows and shrinks depending on usage or burns | Ether since August 2021 | Whether burns depend on activity that may fade |
Designs can also be set or changed by decision: Uniswap's announcement set a permanent 2% yearly inflation rate for UNI, starting after four years.
With supply understood, you can now combine it with price.
Circulating supply generally estimates units available to the public under a provider's methodology. Locked, vested, treasury-held and inaccessible units may be treated differently by different data providers. A contract's total does not automatically tell you the economic float. An allocation schedule may not reflect current unlocks. Record uncertainties rather than filling every field with a confident number.
Section 2 of 4
Market capitalisation and fully diluted value
Market capitalisation is an indicated value
On a street in Toronto, one house sells for C$900,000 (an invented figure). An estate agent might say every similar house on the street is now "worth" C$900,000, so the street's ten houses are worth C$9 million. No one paid C$9 million. One buyer paid for one house, and the rest is an estimate based on that last sale.
Market cap = price × circulating supplyCoinGecko makes this point directly: market cap applies the last traded price to every token and does not measure how much money has actually flowed into the asset. It also notes that a high market cap does not mean you could sell a large amount at that price, that a few holders may own a large share, and that smaller assets are easier to manipulate.
Where the house analogy stops working is speed. House prices change slowly, but a token's last trade can move in seconds, so its market cap can swing far faster. Market cap also ignores every token not yet circulating, which is why a second number exists.
A different circulating estimate changes it without any trade occurring. Market capitalisation is not the amount of cash deposited into a project. It can help compare scale under consistent assumptions, but its interpretation must not exceed the arithmetic.
FDV and its stated supply basis
An illustrative fully diluted value multiplies current price by a specified future or maximum supply basis. Using USD 2 and 100 million maximum units gives USD 200 million. Some providers use total supply rather than maximum supply, and some assets have continuing issuance. Label the chosen basis instead of presenting every FDV number as directly comparable.
FDV assumes the current marginal price can be applied to the stated larger supply for measurement. It does not forecast that future price or prove that all units will circulate on the assumed schedule. It highlights a supply dimension that current market capitalisation may omit. The ratio between current circulating value and the illustrative diluted value can prompt questions about future distribution, but it cannot by itself tell you whether to buy or sell.
| Asset | Unit price | Circulating supply | Circulating value | Stated FDV basis |
|---|---|---|---|---|
| Token A | USD 0.01 | 10 billion | USD 100 million | 20 billion gives USD 200 million |
| Token B | USD 10 | 1 million | USD 10 million | 2 million gives USD 20 million |
| Practice token | USD 2 | 10 million | USD 20 million | 100 million gives USD 200 million |
The supply definitions are supplied for the exercise. These values do not represent available cash or a price forecast.
Calculate fully diluted valuation
Go back to the concert tickets. If the promoter has sold 1,000 tickets at A$100 each so far, but 10,000 seats will eventually be sold, the "fully sold" value of the show at today's price is A$1 million, not A$100,000. The extra 9,000 tickets have not reached buyers yet, but they are coming.
FDV = price × maximum supply (or price × total supply when there is no maximum)FDV is hypothetical. Prices rarely stay still while new tokens arrive, and some future tokens may never be released. Still, the gap between market cap and FDV tells you how much supply is waiting. The clearest way to see this is to work through one example end to end.
Work through a full example
| Measure | Calculation | Result |
|---|---|---|
| Indicated market capitalisation | A$2 × 100 million circulating units | A$200 million |
| FDV on the stated maximum basis | A$2 × one billion units | A$2 billion |
| Circulating share of that basis | 100 million ÷ one billion | 10% |
| Market capitalisation divided by FDV | A$200 million ÷ A$2 billion | 10% |
The two ratios match because both indicated valuations use the same unit price and the chosen FDV denominator is maximum supply. If a data provider uses total supply for FDV, the denominator and the result change. Always name the basis rather than comparing unlabeled figures.
Suppose 50 million units become eligible for release next month. That unlock does not, on its own, establish that all 50 million immediately enter the circulating estimate or are sold. The recipients, restrictions and data provider's method matter. For a separate sensitivity calculation, assume the circulating estimate actually rises to 150 million and the indicated market capitalisation stays at A$200 million. Division gives about A$1.33 per unit. This is a conditional arithmetic scenario, not a rule that supply changes force that price. Demand, executable liquidity and the measured supply can all differ.
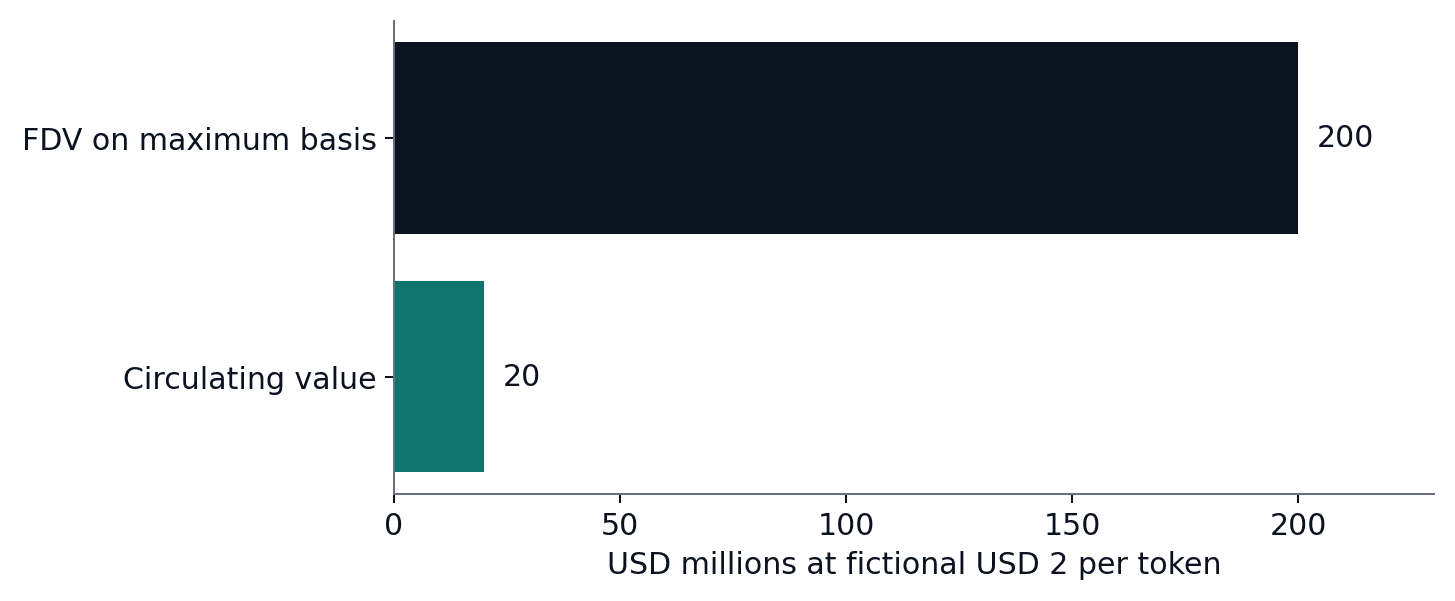
Read diagram as text
At fictional USD 2 per token, 10 million circulating units give USD 20 million market capitalisation.
On a 100 million maximum-supply basis, fully diluted value is USD 200 million, ten times the circulating figure.
The horizontal axis is USD millions. Neither bar measures the cash available for selling a holding.
Section 3 of 4
Unit prices, data definitions and exit limits
Unit price does not establish cheapness
Compare Token A at USD 0.01 with 10 billion circulating units and Token B at USD 10 with one million. A's indicated circulating value is USD 100 million; B's is USD 10 million. The smaller unit price belongs to the larger indicated valuation. Buying more token units is not inherently acquiring more economic value.
Splitting each unit into smaller denominations can lower the quoted unit price without changing the total position. The meaningful questions concern rights, supply, demand, liquidity and price paid for exposure. A high unit count can encourage the impression that a small move will make everyone wealthy, but a target price also implies a much larger aggregate valuation. Calculate that implication and examine whether the underlying demand assumption has evidence.
Read aggregator definitions and liquidity limits
If only a few units trade at USD 2, a holder of a large allocation may be unable to sell near that price. Selling can move through lower bids or change a pool price. A restricted token may also be difficult to transfer or sell. Market capitalisation therefore cannot replace an exit-liquidity check.
Use more than one reputable data view and primary supply documentation where possible, reconcile differences and date the worksheet. Unknown mint permissions, unclear treasury allocations or inconsistent circulating figures should appear in the conclusion. The next lesson examines how allocations and unlocks alter available supply over time. The goal is to make the metric useful while resisting the false precision of a large headline number.
Section 4 of 4
Everyday example, practice and review
Try the following questions aloud or on paper before opening the worked answers. Compare your reasoning as well as your final answer.
Try it yourself
Try each question on paper or explain your answer aloud before opening the worked answers. This practice is for learning; it is not scored.
1. At USD 0.50 with 80 million circulating and 200 million maximum units, calculate both values.
2. If the circulating estimate changes from 80 to 60 million at the same price, what happens to the first value?
3. Why cannot all holders assume they can sell at the last trade price?
Compare with the worked answers
Worked answers
1. Circulating value is USD 40 million. FDV on the maximum basis is USD 100 million.
2. It becomes USD 30 million. The change in the estimate alone changes the metric.
3. The last trade is marginal; aggregate sales can exceed available depth, change prices or encounter restrictions.
Quick knowledge check
Try each question on paper or explain your answer aloud before opening the worked answers. This practice is for learning; it is not scored.
Is market capitalisation the amount of money invested in the project?
Compare with the worked answers
Worked answers
No. It is price multiplied by a stated supply figure, not a record of cumulative cash inflows.
What to remember
✓ Supply labels need methods and dates.
✓ FDV needs an explicit supply basis.
✓ Low unit price and low valuation are different ideas.
Lesson completion check
References and further reading
References
Bitcoin community: Bitcoin Developer Guide Block Chain ↗
Ethereum: Decentralised Autonomous Organisations ↗
MIT OpenCourseWare: Blockchain and Money ↗